Table of contents for easier navigation of the post:
- Key figures
- Traditional metrics
- Traditional metrics systems – The DuPont System of Financial Control
- Traditional Key Performance Indicator Systems – The ZVEI System
- Traditional Indicator Systems – The Profitability and Liquidity Indicator System
- Traditional Ratio Systems – The Ratios au Tableau de Bord
- Traditional Ratio Systems – The Managerial Control Concept
- Modern Performance Measurement Systems.
- Key performance indicators in logistics
- Summary
The tasks of a company must be planned, controlled and managed. For these tasks, a system of key figures is helpful. In such a system, all existing key figures in the company are combined. This makes it possible to assess and evaluate the performance of a company and the individual areas and departments.
Key figures
Transparency about processes and interacting factors is necessary, especially in logistics, to control a company. For many of these factors, it is possible to measure them using key performance indicators. Figures that can be used to depict a small section of operational facts, structures and processes and that represent the state of a company in concentrated form can be defined as key figures.
One advantage that arises from the use of key figures is the reduction of complexity and the associated guarantee of a quick overview. In this way, the following activities can be simplified:
- Analysis
- Ongoing planning
- Control
- Monitoring
Another advantage is the possible measurement of throughput time for individual processes and for the overall process, for example in the form of warehouse key figures. Stocks and areas used can be mapped on the basis of static capacity utilization and on the basis of the utilization of technical resources.
Characteristics of ratios are their informational nature, quantifiability and specific form.
Functions of key figures
With the help of various functions, key figures can be used in a comprehensive way. Possible applications include:
- Stimulus function
- Prioritization function
- Communication function
- Control function
- Monitoring function
- Operationalization function
The excitation function, indicates incidents and irregularities. The basis is a continuous recording of operating data, based on which deviations and possible problems can be identified. A prioritization and default function is created by defining fixed default values. Control processes (communication/control function) can be simplified by using key figures. Personnel control data can be used to assign employees to different tasks and locations. The monitoring function becomes apparent with an ongoing comparison of the target/actual status. The last important function to be mentioned is the operationalization function of targets.
Structuring of key figures and key figure systems
Key figures as well as key figure systems are usually structured and ordered in order to provide an overview, that is, in order to quickly and easily provide insight as well as an overview regarding certain facts.
There are different ways to organize key figures. Possible outlines are:
- Mathematical/statistical
- Outline by purpose
- Outline by temporal horizon
- Organization by type
- Outline by the basis
On mathematical or statistical side, there are both absolute numbers and relative numbers. Relative numbers include outline, relationship and index numbers. While the measurements with absolute numbers take place only in relation to a certain period, with relative numbers the relationship of a part to the whole is indicated (outline numbers), the relationship of different sizes to each other (relationship numbers) and the temporal development (index numbers).
In the outline by purpose, there are descriptive key figures (analysis key figures), which depict the actual situation, and normative key figures (control key figures), which are used to influence and control processes.
In the structuring according to the time horizon, strategic, tactical and operational key figures are used. Characteristics of strategic key figures are the demonstration of a high success effectiveness and the outlasting of a longer-term time. Operational metrics are used more for efficiency measurement. Tactical metrics provide the link between strategic and operational metrics.
In the classification by type, there are structural/framework metrics, productivity/performance metrics, profitability metrics, and quality metrics.
In the Structure by basis, key figures relating to performance, costs and work data play a role. In performance ratios, quantities are assessed in relation to the time required. The throughput of a quantity is to be assessed within a certain time unit. Cost ratios are, for example, process costs, and work data ratios are absolute figures on quantities performed.
Also with the Key figure systems there are various possibilities, in order to arrange and/or arrange them. On the one hand, key figure systems can be subdivided on the basis of six different systematization features, but on the other hand there are not only pure forms. Instead, there are also corresponding mixed forms. The systematization features are:
- Linking the elements (computational systems and ordering systems)
- Method of development (Inductively derived systems and deductively derived systems)
- Type of facts to be measured (measurement of structures and measurement of processes)
- Time dimension (planning systems and control systems)
- Operational functions (intralogistics and inventory management as well as production, financial management)
- Use orientation (analysis system and control system)
Example:
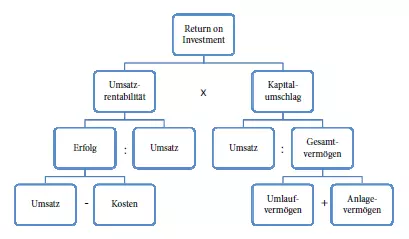
The systematization feature linking the elements forms the formal structure of a key figure system. In the following, an example is described on the basis of calculation systems, how a key figure system is designed by means of the feature linking of the elements:
The structure of the system is tree-like, with a top key figure at the top. The most important statement in the calculation system is made by the top key figure. It is successively decomposed into further key figures. Until certain measured values are reached, the process is carried out over several levels.
A major disadvantage is that auxiliary key figures are often needed to clearly show how the peak key figure was created. Only by showing connections can the necessary operationality for analysis purposes be established.
In a calculation system, the aim is to use all key figures as input for the peak key figure. Calculation systems are not sufficient for the requirements of reality, because a company cannot be controlled with only one key figure.
One way to overcome the limitations of these calculation systems is to use classification systems. Here, the linking of key figures takes place via a logical structure. The inclusion of auxiliary key figures in the system is not necessary. The structural set-up takes place, for example, by structuring according to objects. However, it is also possible that connections are not clearly visible.
Traditional key figure systems
As already mentioned, the key figures of a company are combined in a corresponding key figure system. The aim of such KPI systems is to be able to provide concrete information about a specific issue using absolute numbers and/or ratios. There are both traditional performance measurement systems and modern versions. Traditional performance measurement systems include:
- The DuPont System of Financial Control
- The ZVEI System
- The profitability and liquidity ratio system
- The Ratios au Tableau de Bord
- The Managerial Control Concept
The most common key performance indicator system is the DuPont System of Financial Control. Many other key performance indicator systems are built on this basic system. The most rarely used system is the Managerial Control Concept.
Traditional Key Performance Indicator Systems – The DuPont System of Financial Control
One of the traditional key performance indicator systems is the DuPont System of Financial Control. It is probably the most widely used system and, accordingly, can be considered the mother of key performance indicator systems.
The DuPont system is also described as a calculation system that is primarily used for analysis. The primary goal is not to maximize profit, but to maximize return on investment.
The benefits that accrue with the operation of the system are many. These include the following aspects:
- High expressiveness
- Overviewability
- Visibility
- Possibility of expansion
- Evaluation of operational performance
A disadvantage is that certain cost considerations are not available and a comparison with other metrics is necessary for evaluation.
Traditional Key Performance Indicator Systems – The ZVEI System
The ZVEI system was developed by the Central Association of the Electrotechnical Industry and is increasingly used in Germany.
The ZVEI system is used as a tool for analysis and control. This is made possible by intra- and inter-company comparisons. The system is industry-neutral and allows analyses in the areas of growth and structure. Another feature of the system is that it can be used as a planning tool. In addition, as with the DuPont system, the cause-effect relationships are to be revealed from the decomposition of a key figure. Ratios and differentiation enable this uncovering. The ZVEI system improves and refines the DuPont system.
Traditional Ratio Systems – The Profitability and Liquidity Ratio System
Compared to the two ratio systems described above, the profitability and liquidity ratio system contains relatively few ratios. But two top ratios (profitability and liquidity). This variant, which is also abbreviated to RL ratio system, represents a pure classification system. With the development of the profitability and liquidity ratio system, a multi-objective system was to be created instead of the previous mono-objective tracking.
The system consists of four parts in total: A general part and a special part, each with a profit and a liquidity component consideration.
In order to manage the company as a whole, the most important key figures from the following areas are linked together:
- Cost accounting
- Financial planning
The RL key performance indicator system serves primarily as a tool for planning and control.
Traditional Ratio Systems – The Ratios au Tableau de Bord
The concept of this system is that the Ratios au Tableau de Bord can be used as an individual management tool. To this end, the system must be developed to be situation-specific and customized for individual business units.

Depending on the need, a board can be created with multiple metrics. These include:
- financial metrics
- non-financial metrics
- past-oriented metrics
- future-oriented metrics
Current information is necessary to create the metrics. Due to the fact that the data from the accounting system is only considered supplementary, it is quite conceivable that due to a lack of reconciliation several tableaus exist.
A missing or bad revision leads to the fact that the measured variables become unclear or outdated with time. Local data collection can lead to the overrepresentation of an area.
Advantages are shown by flexibility and fast adaptation to new circumstances.
As the name suggests, the system is mainly used in France. Outside these national borders, the variant has not been able to achieve widespread use. According to scientists, the reason for this is the lack of international reports and descriptions. The first findings were published only after several years of application and experience. The Balanced Scorecard (see below), whose cockpit is similar in principle to the Ratios au Tableau de Bord, was able to establish itself much better.
Traditional Indicator Systems – The Managerial Control Concept
This concept was created as a decision-making and control system. With the Managerial Control Concept, the company management has several top key figures at its disposal in contrast to the previous key figure systems, where only one or two are reported.
The Managerial Control Concept is divided into the following classic functional areas:
- Production
- Finance
- Sales
In addition, the Managerial Control Concept contains the following hierarchies:
- Top management
- Middle management
- Lower management
Information transfer and summarization occur upward from one level of hierarchy to the next. This division creates a clear information transfer.
Modern Performance Measurement Systems
In the context of key performance indicators and performance measurement systems, other systems have emerged that are used to assess and evaluate the performance of a company. With these new performance measurement concepts, some of the rigid, formal structures of traditional models are broken down, expanded or derived. Such performance measurement systems include the balanced scorecard (BSC) and the supply chain operations reference model (SCOR). The main focus of both concepts is on operational execution.
Balanced Scorecard (BSC)
The Balanced Scorecard can be seen as a communication, learning and control concept for the implementation of a strategy. This is to avoid the weaknesses of the purely financially designed performance measurement systems. The Balanced Scorecard is a holistic concept that considers four different perspectives:
- Supplier and customer perspective
- Innovation and knowledge perspective
- Financial perspective
- Internal process-oriented perspective
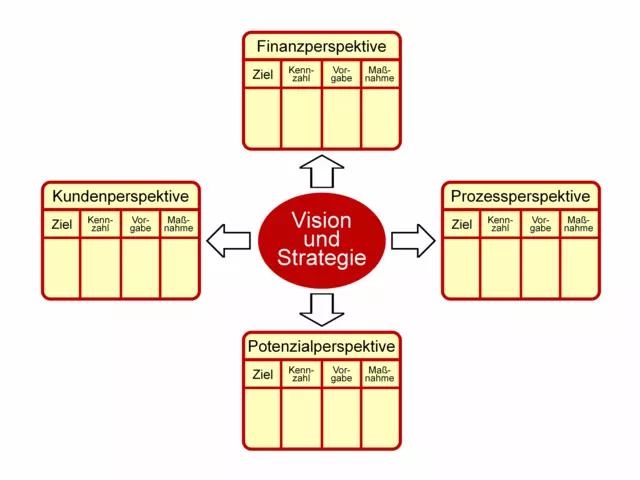
The supplier and customer perspective uses customer satisfaction, market share, and service level data. For the innovation and knowledge perspective, employee know-how, employee satisfaction, and innovation play into the equation. The financial perspective looks at cash flow, enterprise value and return on investment, while for internal business processes, customer service and operational processes are significant.
The benefits of the balanced scorecard are:
- Orientation on forward-looking metrics
- Consideration of cause-effect relationships
- Possibilities for individual adjustments
The disadvantage is that the Balanced Scorecard does not provide a methodology to develop metrics specifically. In the literature, no procedure can be found, in which the type of selection of key figures or even the calculation of key figures is described. Furthermore, the Balanced Scorecard focuses exclusively on top management. The creation takes place top-down.
Supply Chain Operations Reference (SCOR) Model
In the SCOR model, several aspects of cross-enterprise processes are considered. The focus is on the entire supply chain, even though the model always starts from the perspective of a single company.
The features of the model are industry neutrality as well as description, standardization, measurement and evaluation of process chains. The model consists of four different levels, which are set up hierarchically. It is also differentiated according to internal and external performance characteristics.
The tasks performed at each level are as follows:
Level 1: Top Level.
- Process category “Plan” is monitored
- Procure process category is monitored
- Process category “Manufacture” is monitored
- Process category “Deliver” is monitored
Level 2: Configuration level.
- Define different modules
- Decomposing the supply chain into sub-processes
Level 3: Process element level.
- Decomposition of modules into individual elements
- Combining the elements into a causal chain by input-output relation
Level 4: Implementation level.
- Detailing the process elements
- Decomposition of the elements into different activities
The advantage of the model is that companies can deeply analyze their current. The hierarchy, the coordinated structure and the standardized framework allow this detailed analysis. Thus, a uniform standard for performance measurement and communication of the entire supply chain is created. In addition, companies can learn from partners and their best practice approaches.
The disadvantage of the model is that its cross-industry application creates a high degree of abstraction. It is possible that partner dependency will increase, causing companies to lose sovereignty.
The SCOR model has not really been able to establish itself so far, but it can be seen as a suggestion. A transfer to other application areas is relatively easy due to the level model.
Key Performance Indicators in Logistics
Categorization of key performance indicators: financial, customer, process.
In logistics, three groups of key performance indicators can be distinguished. Productivity key performance indicators, profitability key performance indicators and quality key performance indicators. Productivity indicators measure productivity at the technical and personnel level, profitability indicators measure logistics costs and company-specific results, and quality indicators measure the degree of target achievement.
Dr. Hans-Ulrich Krause and Professor Dr. Dayanand Arora have summarized the most important KPIs in their handbook Controlling KPIs of the following dimensions:
- Financial ratios: earnings ratios, profitability ratios, liquidity ratios, cash flow ratios
- Key figures customers: customer relationship key figures, marketing communication key figures, price management key figures
- Key figures processes: Project key figures, quality key figures, supply chain management key figures
Especially with the parameters in the supply chain management plays of course the logistics a supporting role. Thus, their key performance indicators are divided into the following four sub-items: Procurement Efficiency, Misdelivery Rate, Misdelivery Rate and Delivery Readiness Level. Due to their underlying complex processes, key performance indicators are difficult to combine and compare. Therefore, they are usually viewed or assessed from different perspectives. For example, the cost center tends to look at the profitability and cost coverage of a company, while those responsible for logistics tend to look at throughput or the number and length of round trips.
Key figure system in intralogistics and distribution centers
A complete bundling of all key figures occurring in warehouse and distribution systems is possible today, but difficult due to the multi-layered nature of complex facilities. In contrast, a predefined KPI system makes it possible to compare different KPIs with each other in a meaningful way and to generate a so-called ordered set of KPIs. The goal of such a system: an informative clear statement of the individual processes and the goals linked to them.
A KPI system is used in the management and control of logistics systems. The figures calculated in it, usually from raw data, provide the employee with a significant process overview. A distinction is made between verifiable characteristics (performance) and a comparable evaluation (benchmarking).
As already described, a key performance indicator system fulfills various functions. These include the information function, analysis function, control function and documentation function. So how could a consistent key performance indicator system for internal logistics be structured in a distribution center? Dipl.-Ing. K. Heptner pursued this question and developed the following graphic, which is based on three superordinate key figures. The first two points belong together.
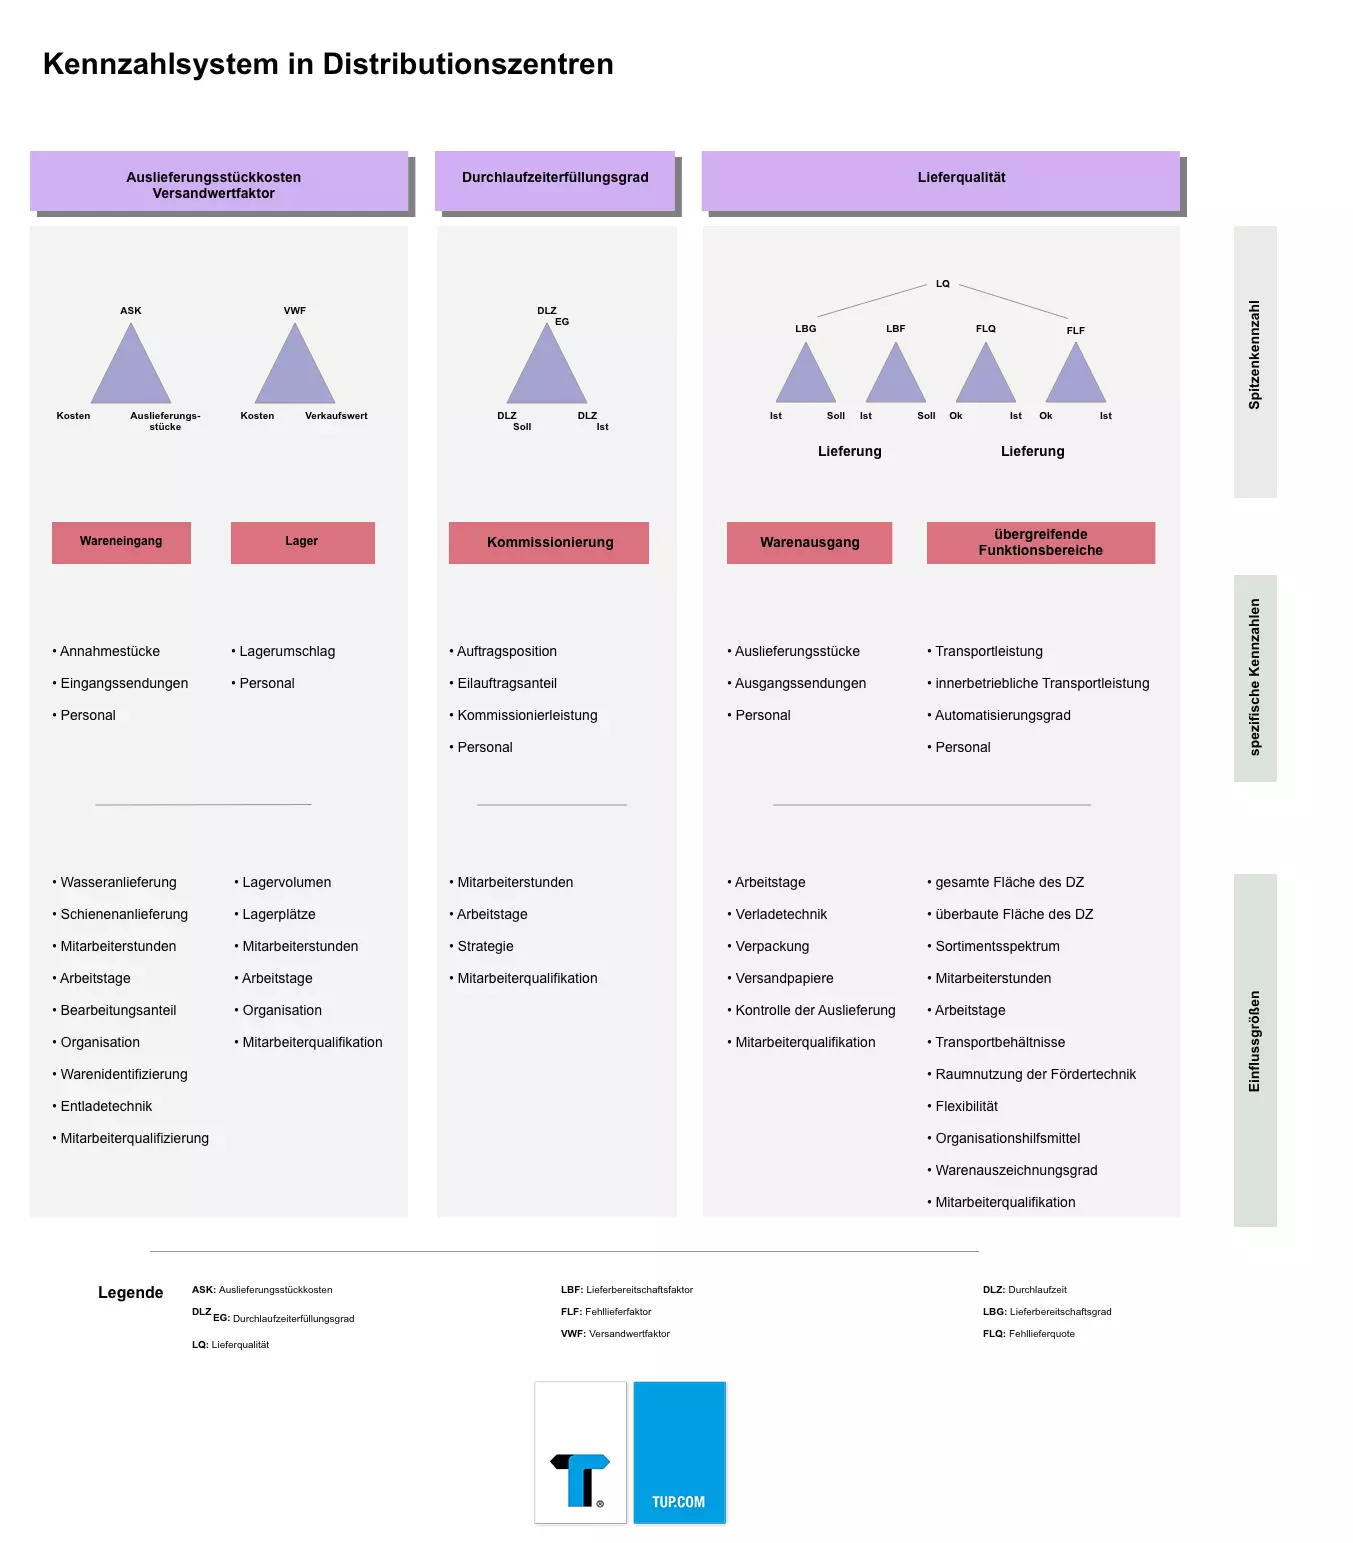
- Delivery cost: total distribution center cost divided by the number of delivery items per unit time
- Shipping value factor: the quotient of total cost and sales value of inventory per unit of time
- Turnaround time fulfillment ratio: Quotient of target and actual order turnaround time
- Delivery quality: function (mapping) of delivery readiness rate and factor, and misdelivery rate and factor (see also Perfect Order Fulfillment)
A similar approach is taken by the VDI Guideline 4400 Sheet 3. It presupposes the following representation or objectives of a performance measurement system:
- High logistics efficiency (big picture)
- High logistics performance (short throughput times, high productivity, high delivery service)
- Low logistics costs (low inventory costs, low process costs)
Operationalization of logistics objectives
The key performance indicators themselves are used to operationalize the logistics objectives.
Important here: In addition to the performance indicators for measuring logistics performance and the cost indicators for measuring logistics costs, the KPI system contains so-called structural indicators. They are not assigned to any of the targets in benchmarking studies.
Structural metrics examples:
- Picking order items per operating calendar day.
- Goods delivery per operating calendar day
- Transport time to a customer per goods shipment
- Transport distance per shipment
- Shipping weight per shipment
Beyond the KPI systems already described here, there are also special KPI systems in intralogistics, which are individually tailored to the individual processes.
Summary
With the help of a KPI system, the tasks of a company are planned, monitored and controlled. In such a system, all key figures available in the company are brought together, which in turn can fulfill different functions. There are both traditional and modern KPI systems, which are used to varying degrees and also differ in terms of their strengths and weaknesses. What they all have in common is the requirement to present complex facts and assessments regarding the company’s performance in a simplified form that can be quickly recorded.
Further links:
For general information on operating data and its collection, see Operating data collection.
Further information on the subject of key figures, value-added processes as well as the controlling of logistics can also be found at Supply Chain Management (SCM); also interesting is the corresponding optimization by means of Process Chain Management.
Image source: © Sergey Nivens – Fotolia.com
Warehouse management - as simple as possible, as complex as necessary
Our WMS offers you an individually tailored, lean and process-oriented warehouse management.

Also available in Deutsch (German)